
|
|||||||||
|
|
|||||||||
|
Executive Summary
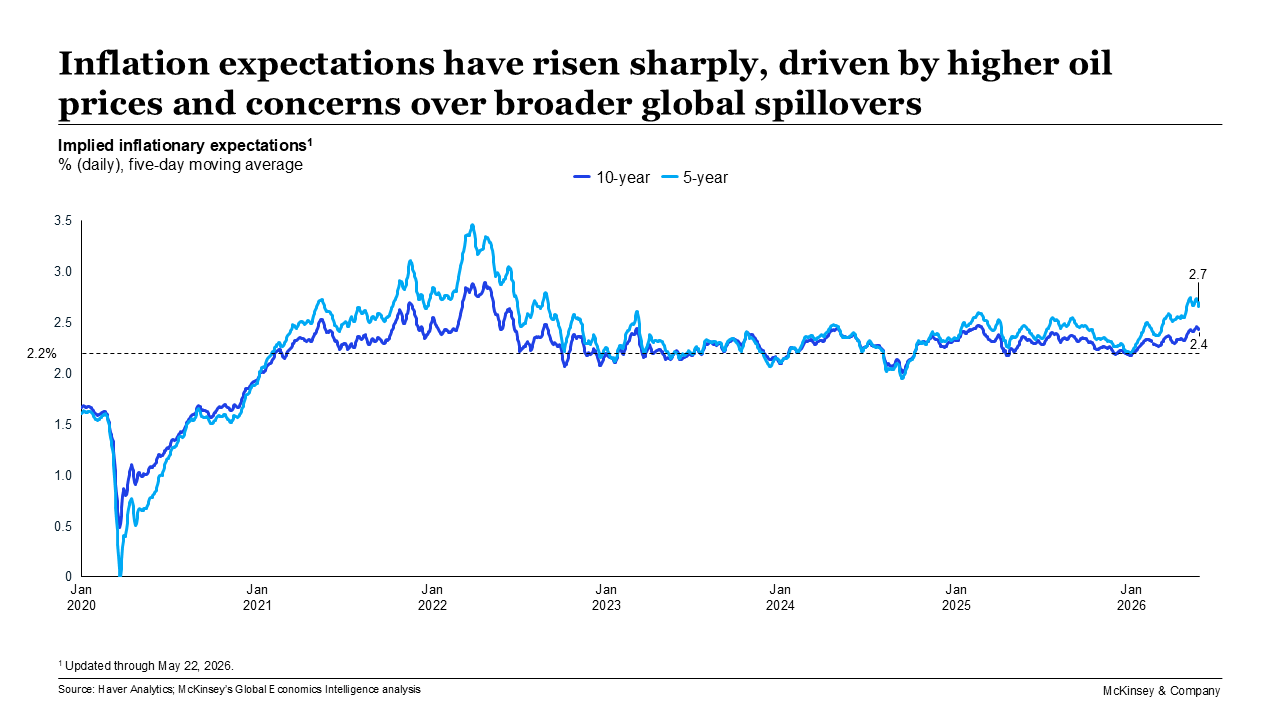
As energy prices trend higher and drive inflation, consumer confidence is ebbing—central banks have a dilemma: whether to tackle inflation by raising policy rates or ease them to provide a stimulus.
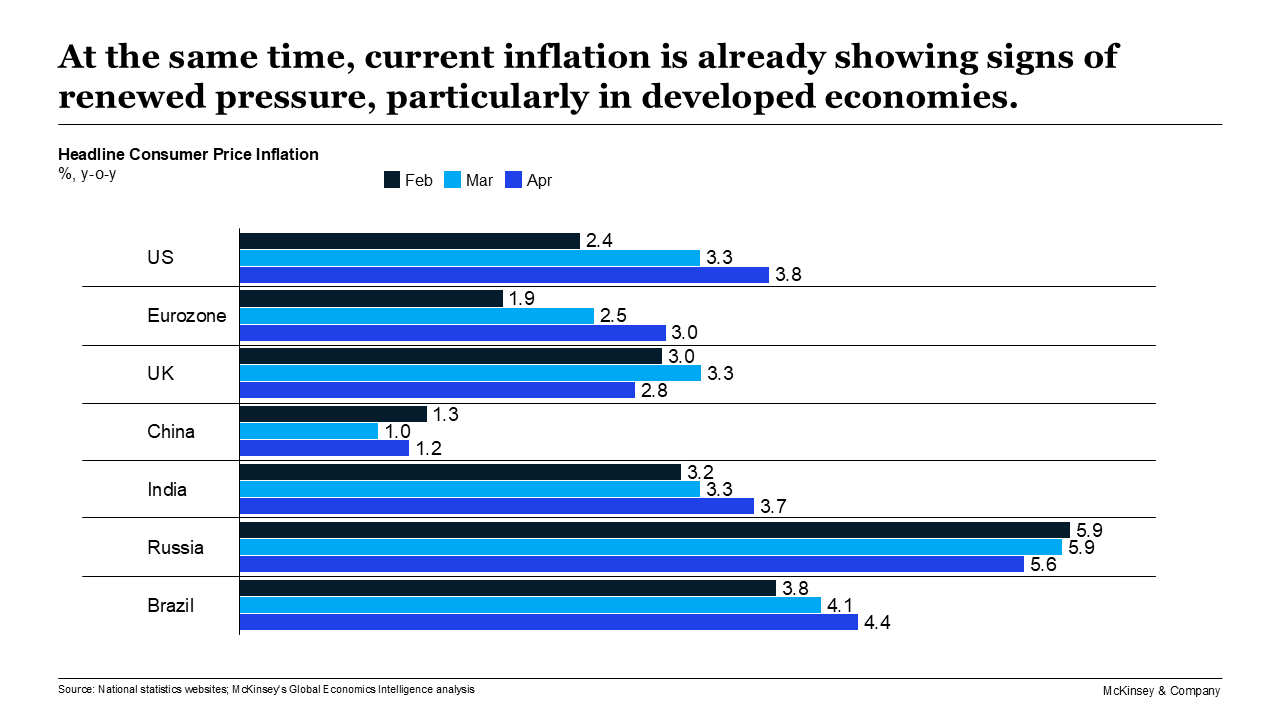
Tensions in the Middle East, particularly the stand-off in the strait of Hormuz that has locked some 1,600 vessels in this 104-mile-long international waterway, continue to shape the markets, influence consumer and business behavior, and exercise the minds of central bankers and others charged with navigating current economic headwinds. Energy prices are a key pressure point with prices settling at their highest level since 2022 across major energy commodity classes, although commodity markets more generally have been broadly stable. Gold prices have fallen as inflation concerns pushed yields higher and supported the dollar, reducing demand for the “yellow metal.” Industrial metals have also been affected with aluminum and copper prices both higher. At the same time, rising vegetable oil prices have continued to push up the overall food price index, which has increased by 5% since February 2026. Meanwhile, higher oil and fertilizer prices are also adding upward pressure on global food prices. What is the knock-on effect on individual economies? Inflation among surveyed developed economies has accelerated across the board, driven primarily by higher energy prices. Inflation in emerging economies is broadly following the same trajectory, though inflationary pressures remain more visible at the producer level, with limited pass-through to consumers so far. Notably, inflation expectations have increased—both from the market as well as from a consumer perspective. In the US, In April, median inflation expectations increased by 0.2 percentage points to 3.6% at the one-year-ahead horizon. The US consumer price index (CPI) climbed 3.8% year over year in April, after rising 3.3% in March. Core inflation rose 2.8% (annualized). Headline consumer price inflation in the eurozone accelerated to 3.0% annually in April 2026. The rise was primarily driven by higher energy prices (up 10.8% annually), even after some countries implemented tax cuts to cushion consumers from the impact. Continued disruption is likely to push inflation further or keep price pressures elevated in the coming months even if spillover effects on core goods remain relatively contained at 2.2%. UK Inflation eased in April, with headline CPI moderating to 2.8% from 3.3%, largely reflecting lower household energy bills following the April Ofgem price-cap reduction and related government energy-bill measures. However, producer input price inflation accelerated to 7.7% year on year in April (from 5.3% in March), while renewed increases in oil and gas prices amid escalating Middle East tensions raised concerns that energy-driven inflationary pressures could re-emerge later in 2026. Global consumer confidence has fallen again, with the decline driven primarily by weaker sentiment in the UK. Across the Pond in the US, the Consumer Confidence Index (Conference Board) edged down to 93.1 in May from an upwardly revised 93.8 in April. At the same, while retail sales have continued to grow in nominal terms across most countries; real growth is more subdued, as signs of stress start to emerge in some discretionary categories. In the US, April’s retail and food services sales (adjusted for seasonal variation and holiday and trading-day differences) were $757.1 billion, up 0.5% from March’s revised $753.4 billion. |
|||||||||
|
|
|||||||||
|
|||||||||
|
|
|||||||||
|
All of which leaves central banks with a dilemma: whether to seek to hobble inflation by raising policy rates or to loosen their monetary stance to provide a stimulus. Accordingly, central banks mainly kept rates on hold in May, closely monitoring inflation risks before making further policy moves. However, the Bank of Mexico cut its policy rate by 25 basis points to 6.5% on May 8, while also announcing the end of the easing cycle that began in March 2024. Brazil too made a similar rate cut to 14.50% on April 29, citing uncertainty in the Middle East as one factor in its decision.
Meanwhile, Kevin Warsh was sworn in as Federal Reserve chair, succeeding Jerome Powell, whose term ended on May 15. Warsh previously served as a Fed governor from 2006 to 2011. May 28 saw US real gross GDP growth revised down 0.4 percentage points to an annual rate of 1.6% percent in the first quarter of 2026, when the U.S. Bureau of Economic Analysis (BEA) released a revised estimate. This compares with a real GDP growth of 0.5% in the fourth quarter of 2025. According to the BEA, the contributors to the first-quarter increase in real GDP were exports, investment, consumer spending, and government spending. Imports, which are a subtraction in the GDP calculation, increased. The downward revision for first-quarter growth primarily reflects changes to investment and consumer spending. Growth remains potentially more challenging in Europe. Euro area (EA) GDP in the first quarter grew by 0.1% quarter on quarter and 0.2% year on year. Growth rates this quarter were relatively uniform across the largest EA economies. The European Commission has cut the 2026 eurozone GDP growth forecast to 0.9%, down from its previous 1.2% projection, while the International Monetary Fund anticipates 1.1%. Real GDP in the UK expanded by 0.6% quarter on quarter and 0.3% month on month in March, supported by stronger services activity and a rebound in manufacturing output. However, business sentiment deteriorated sharply later in May. Among emerging economies, Mexico’s GDP contracted by 0.6% quarter on quarter during the first quarter of 2026, but grew 0.4% annually. Encouragingly, activity indicators find manufacturing and services sectors to be accelerating on a global basis, with output and new orders expanding—this despite rising prices and supply-chain delays. Rising output and new orders were the main drivers of an overall increase in manufacturing purchasing managers’ indexes (PMI). In the US, the industrial production index increased slightly to 102.5 in April. S&P’s manufacturing PMI climbed to 55.3 in May 2026, from 54.5 in April. That said, respondents across services sectors reported that input prices are rising at an accelerated pace. In the US, the services PMI eased to 50.9 in May (51.0 in April). Looking at employment, we see that US non-farm payroll employment rose by 115,000 in April. Job gains were registered in healthcare, transportation and warehousing, and retail trade. Federal government employment continued to decline. Unemployment remained at 4.3%. In the UK, an interim report on young people and work by former minister Alan Milburn (released May 28) warns that one in six young people could be Neet (not in education, employment or training) in the next five years unless urgent action is taken. Financial markets remained volatile in May, with gains in Japan and the US offset by declines in parts of Europe and developing markets. Although market volatility eased slightly, it remained elevated, with oil markets still at above-average levels. In April, the S&P 500 was up 10.5%, bringing the one-year return to approximately 31.1%; the Dow Jones climbed 7.2% over the month and posted approximately a 24.2% one-year return. Rising inflation concerns pushed interest rates higher, as bond markets priced in tighter-for-longer monetary policy. |
|||||||||
|
|
|||||||||
|
|||||||||
|
|
|||||||||
|
Across the globe, once-familiar trade patterns and strategic ties are being challenged by geopolitical tensions and regional conflicts, while international agreements are being reshaped. The world’s two largest economies, the United States and China announced new trade commitments as part of President Trump’s three-day state visit to China which ran May 13–15. These included increased Chinese purchases of US agricultural products and restored market access for some US beef and poultry exports. The White House said China would purchase at least $17 billion per year in US agricultural goods through 2028. From China’s perspective the two economies have agreed on a new vision of building a constructive bilateral relationship of strategic stability, defined as “a positive stability with cooperation as the mainstay, a sound stability with moderate competition, a constant stability with manageable differences, and an enduring stability with promises of peace.”
Meanwhile, China has been seeking to strengthen trade relationships with multiple countries in the wake of last year’s Busan Summit in South Korea between Chinese leader Xi Jinping and the US president. January saw China and South Korea agree to significantly enhance cooperation around technology, trade and transportation, while the same month China and Canada announced lower tariffs on Chinese EVs and Canadian agricultural products. More recently, China extended its zero-tariff treatment to cover all 53 African countries with which it has diplomatic ties on May 1. A week before the latest US-China summit, Brazilian president Luiz Inácio Lula da Silva met President Trump at the White House on May 7, where the two leaders discussed tariffs and trade plus other economic issues including rare earth metals, foreign policy, and combating organized crime and drug trafficking. On May 19, the European Union finalized a trade deal with the US to stabilize the transatlantic economy. The EU will eliminate tariffs on US industrial goods in exchange for a 15% cap on US tariffs for most European exports. Notably, Mexico and the European Union agreed to modernize their Global Agreement signed in 2000, which originally focused on trade liberalization and political cooperation. The new agreement significantly broadens the scope of the partnership by reducing or eliminating remaining tariffs on agricultural and industrial products, improving market access for services and public procurement, and strengthening investment protections through updated dispute-settlement mechanisms. India and Canada have successfully concluded a second round of negotiations for the proposed Comprehensive Economic Partnership Agreement (CEPA), while India and New Zealand signed a landmark free-trade agreement on April 27, aiming to deliver duty-free access for all Indian exports once the deal is ratified. So, what is happening on the ground? Global export momentum has remained uneven in the opening months of 2026, with strong growth in China, Mexico, and US. However, import trends diverged in early 2026, with growth in China, India, and Mexico, while US imports normalized from 2025 highs. Container trade volumes softened in April in the face of persistent geopolitical disruptions, while supply-chain pressures rose to their highest level since mid-2022, amid prolonged shipping disruptions. US-bound shipping rates from Shanghai firmed modestly in April–May influenced by the renewed disruptions, while US to Shanghai freight rates rebounded in April after easing through much of late 2025 and early 2026. Looking at individual economies, we see that US exports for March reached $320.9 billion, $6.2 billion more than February’s exports. March imports were $381.2 billion, $8.7 billion more than in February. The monthly deficit increased by 4.4% to $60.3 billion. April saw cross-border trade (imports and exports) in China record a year-on-year growth rate of 18.7%, an acceleration from the 12.7% rise seen the previous month. Specifically, export growth accelerated to 14.1% in April, from 2.5% in March. Meanwhile, import growth maintained a robust growth rate of 25.3%, similar to the pace seen in March (27.8%). Finally, India’s merchandise exports rose to $43.56 billion in April 2026 but imports also increased sharply to $71.94 billion, widening the trade deficit to $28.38 billion in April—this is attributable to disrupted global shipping routes and elevated freight and energy costs that have significantly impacted India’s import bill.
***
A May 21 report from the McKinsey Global Institute (MGI) explores how much manufacturing ramp-up would be needed to address current US trade dependencies. The MGI report— Ramping up manufacturing in America?— looks at the $3 trillion in manufactured goods that the United States imports annually in the context of deepening geopolitical fragmentation. The authors found that some 25% of these imports are characterized by notable vulnerabilities across three dimensions: criticality to national security, supply concentration, and geopolitical distance from trade partners. Moreover, some 5 percent of manufacturing imports—overwhelmingly computers and electronic products—have all three dependencies. To address these key vulnerabilities would require a transformed industrial base and corresponding upstream inputs, which the authors suggest could cost in the order of $2 trillion—about 6 percent of GDP. Importantly, they argue that funding could be the (relatively) easy part, with specialized skills, supporting infrastructure, sufficient energy, and shovel-ready projects the additional requirements to achieve the transformation. “Ramping up would be an all-encompassing, national effort,” the authors conclude. |
|||||||||
|
|
|||||||||
|
|||||||||
|
|||||||||
|
Regional and Country Summary
US CPI up 3.8% year on year in April while eurozone’s headline inflation reaches 3.0%; however, UK enjoys temporary respite as CPI eases to 2.8% in context of current energy price cap.
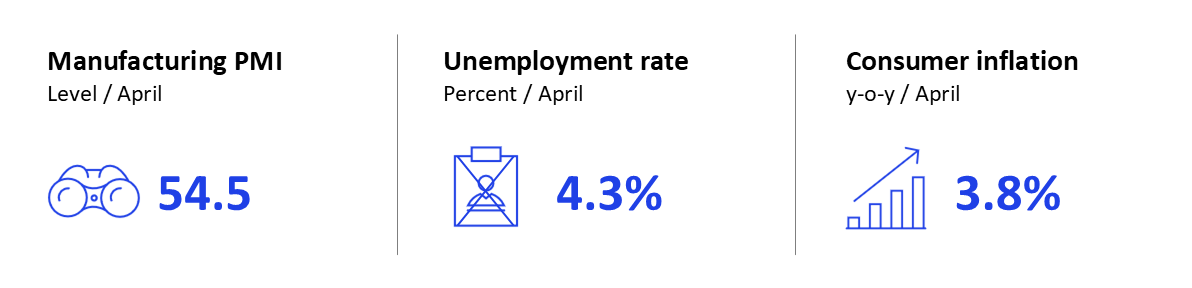
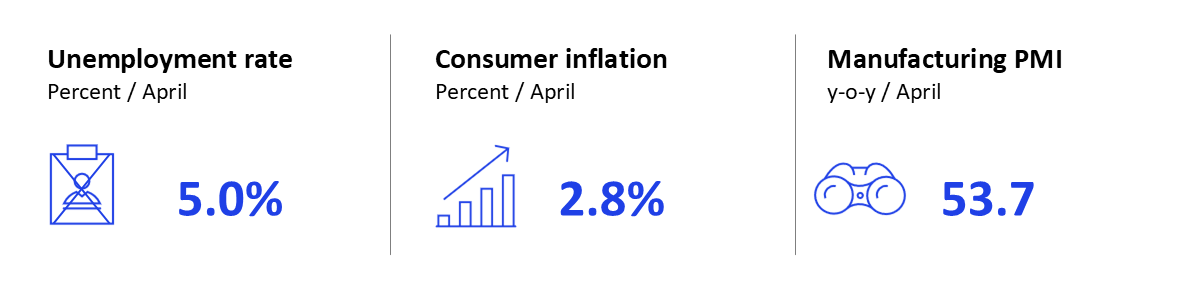
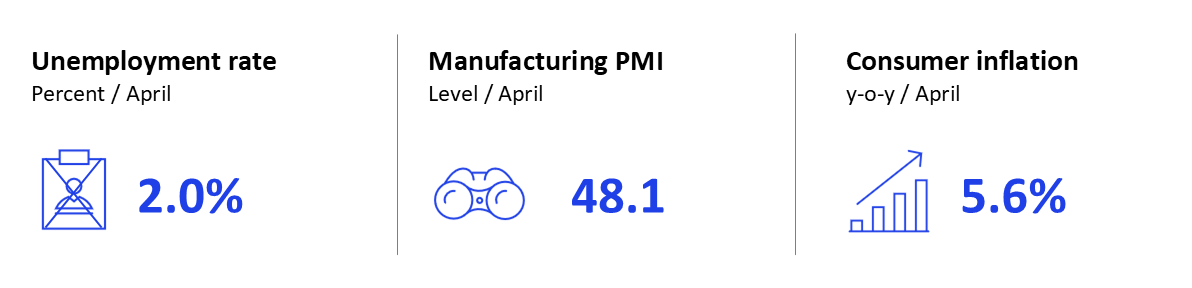
United States CPI up 3.8% year over year in April, after rising 3.3% in March; Kevin Warsh is new Fed chair. The consumer price index (CPI) climbed 3.8% year over year in April, after rising 3.3% in March. Core inflation rose 2.8% (annualized). In April, median inflation expectations increased by 0.2 percentage points to 3.6% at the one-year-ahead horizon. Kevin Warsh was sworn in as Federal Reserve chair, succeeding Jerome Powell, whose term ended on May 15. Warsh previously served as a Fed governor from 2006 to 2011. He takes over with inflation still above the Fed’s 2% target. Powell will remain a Fed governor for a period still to be determined. Non-farm payroll employment rose by 115,000 in April. Job gains were registered in healthcare, transportation and warehousing, and retail trade. Federal government employment continued to decline. Unemployment remained at 4.3%. The industrial production index increased slightly to 102.5 in April. S&P’s manufacturing purchasing managers’ index (PMI) climbed to 55.3 in May 2026 (54.5 in April); the services PMI eased to 50.9 in May (51.0 in April). |
|||||||||
|
|
|||||||||
|
|||||||||
|
|
|||||||||
|
April’s retail and food services sales (adjusted for seasonal variation and holiday and trading-day differences) were $757.1 billion, up 0.5% from March’s revised $753.4 billion. The Consumer Confidence Index (Conference Board) edged down to 93.1 in May from an upwardly revised 93.8 in April.
On the housing market, the 30-year fixed-rate mortgage decreased slightly to 6.3% in April. Existing home sales increased by 0.2% in April, while housing residential starts declined to 1,465,000 (below the revised March estimate of 1,507,000)—a 2.8% drop. Completions in April were up, reaching 1,449,000, compared with the revised March estimate of 1,382,000. In April, the S&P 500 was up 10.5%, bringing the one-year return to approximately 31.1%; the Dow Jones climbed 7.2% over the month and posted approximately a 24.2% one-year return. March exports reached $320.9 billion, $6.2 billion more than February’s exports. March imports were $381.2 billion, $8.7 billion more than in February. The monthly deficit increased by 4.4% to $60.3 billion. The U.S. Court of International Trade ruled that the Section 122 10% import surcharge was unlawful, finding that the measure did not meet the statutory requirements for temporary balance-of-payments tariffs. The court’s relief was limited to the named plaintiffs, rather than a nationwide injunction, and the administration has appealed. The United States and China announced new trade commitments following a bilateral summit, including increased Chinese purchases of US agricultural products and restored market access for some US beef and poultry exports. The White House said China would purchase at least $17 billion per year in US agricultural goods through 2028. |
|||||||||
|
|
|||||||||
|
|
|||||||||
|
Eurozone
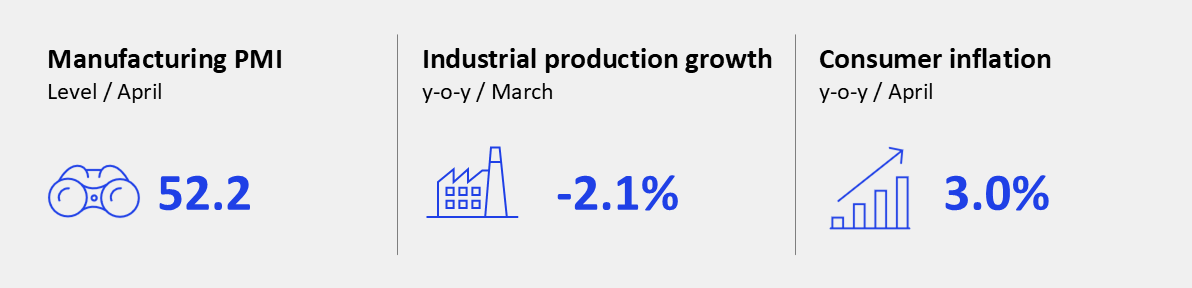
GDP grew 0.1% quarter on quarter, while headline consumer price inflation accelerated to 3.0%; key ECB interest rates unchanged. Euro area (EA) GDP in the first quarter grew by 0.1% quarter on quarter and 0.2% year on year. Growth rates this quarter were relatively uniform across the largest EA economies—with France flatlining (0.0%), Italy growing by 0.2%, and Germany by 0.3%—except for Spain, which sustained its strong momentum with a growth rate of 0.6%. Economic recovery is being tested by a Middle East–driven energy shock, which has triggered downward revisions in growth and upward revisions on inflation. The European Commission cut the 2026 eurozone GDP growth forecast to 0.9%, down from its previous 1.2% projection, while the International Monetary Fund anticipates 1.1%. Headline consumer price inflation accelerated to 3.0% annually in April 2026. The rise was primarily driven by higher energy prices (up 10.8% annually), even after some countries implemented tax cuts to cushion consumers from the impact. Still, continued disruption is likely to push inflation further or keep price pressures elevated in the coming months even if spillover effects on core goods remain relatively contained at 2.2%. |
|||||||||
|
|
|||||||||
|
|||||||||
|
|
|||||||||
|
The European Commission confirmed that there is currently no immediate concern for the security of gas supply in the EU for the next winter season. It noted that EU gas storage levels could reach 80% by the end of the summer, which would secure gas supply for next winter (2026–27).
Incoming data suggests that the conflict is weighing on economic activity as well. Industrial production in the eurozone increased by 0.2% monthly in March 2026, though it recorded a 2.1% decrease annually. Momentum in the sector remains weak: the S&P Global Flash Eurozone Composite Purchasing Managers’ Index (PMI) dropped to a 31-month low of 47.5 in May 2026, down from 48.8 in April. Additionally, longer delivery times and rising input prices suggest that value chains are coming under pressure. On April 30, the European Central Bank (ECB) Governing Council decided to keep the three key interest rates unchanged. The Council noted that, while its previous assessment remains broadly consistent with incoming data, upside risks to inflation and downside risks to growth have intensified. The longer the war in the Middle East continues and energy prices remain high, the stronger the likely impact will be on broader inflation and the economy. On May 19, 2026, the EU finalized a trade deal with the US to stabilize the transatlantic economy. The EU will eliminate tariffs on US industrial goods in exchange for a 15% cap on US tariffs for most European exports. After the 27 EU member states the European Parliament as well has ratified the text on June 16 to meet a deadline of July 4, 2026. |
|||||||||
|
|
|||||||||
|
|
|||||||||
|
United Kingdom
The UK economy remained modestly resilient in May, although softer business activity and weaker retail sales pointed to slowing momentum entering Q2. Real GDP expanded by 0.6% quarter on quarter and 0.3% month on month in March, supported by stronger services activity and a rebound in manufacturing output. Construction output rose modestly following five consecutive quarterly declines. However, business sentiment deteriorated sharply later in May: the flash composite Purchasing Managers’ Index (PMI) fell into contractionary territory at 48.5, down from 52.6 in April, with services activity weakening particularly sharply. Retail sales softened in April after a relatively strong Q1. Retail sales volumes fell by 1.3% month on month, although the decline was distorted by a more than 10% fall in fuel purchases, partly reversing March stockpiling ahead of energy price rises. While three-month retail volumes remained positive (+0.5%), the pace of growth was notably weaker than earlier in the year. Consumer confidence improved marginally in May but remained firmly negative. Inflation eased in April, with the headline consumer price index (CPI) moderating to 2.8% from 3.3%, largely reflecting lower household energy bills following the April Ofgem price-cap reduction and related government energy-bill measures. Services inflation fell sharply to 3.2% from 4.5%, while core CPI also declined, suggesting broader underlying price pressures were easing. However, producer input price inflation accelerated to 7.7% year on year in April (from 5.3% in March), while renewed increases in oil and gas prices amid escalating Middle East tensions raised concerns that energy-driven inflationary pressures could re-emerge later in 2026. In late May, Ofgem announced that the household energy price cap would rise by around 13% in July, reinforcing expectations that the recent inflation improvement may prove temporary. |
|||||||||
|
|
|||||||||
|
|||||||||
|
|
|||||||||
|
The latest Monetary Policy Committee (MPC) decision on April 30 held the Bank Rate at 3.75% by an 8–1 vote. The next MPC decision is scheduled for 18 June.
Fiscal conditions also remained tight. Government borrowing in April reached £24.3 billion, the second-highest April borrowing figure on record, reflecting higher public spending and elevated debt interest payments. UK gilt yields rose sharply during May, with the 10-year yield briefly exceeding 5% and the 30-year yield approaching 5.8% before partially reversing later in the month. Weaker activity and inflation data later in May contributed to the reversal as markets scaled back expectations that the Bank of England would need to tighten policy further, although concerns around fiscal sustainability continued to weigh on sentiment. Externally, imports continued to outpace exports, contributing to a persistent trade deficit, while weak external demand continued to provide limited support to UK growth. The labor market continued to soften, despite unemployment edging down slightly to 5.0% in January–March. Payrolled employment declined further in both March and April, while vacancies fell to 705,000, their lowest level since 2021. Average regular earnings growth slowed to 3.4% year on year in January–March. Softer payroll growth, lower vacancies, and moderating wage growth pointed to easing labor-market tightness. Real wage growth also remained only marginally positive. Meanwhile, an interim report on young people and work by former minister Alan Milburn (released May 28) warns that one in six young people could be Neet (not in education, employment or training) in the next five years unless urgent action is taken. |
|||||||||
|
|
|||||||||
|
|
|||||||||
|
China economy sends out mixed messages; India remains one of the world’s fastest-growing major economies; Mexico cuts interest rate.
China
In April, China’s economic activities sent out mixed messages: growth rates decelerated in investment and real estate but accelerated in trade. China’s industrial output growth decreased to 4.1% year on year in April, compared with 5.7% in March. The decline in growth was largely driven by manufacturing sectors (4.0% in April versus 6.0% in March, mostly dragged by the chemical and pharmaceutical industries) and mining activities (3.8% in April, 5.7% in March). Utilities growth accelerated to 5.3% from 3.8% in March. Meanwhile, the services production index also slowed, down to 4.3% in April from 5.0% in March. Investment returned to contraction in April after a moderate bounce back in the first quarter. Overall fixed-asset investment registered a year-on-year contraction of –8.0% in April, from 1.6% growth in March. The decline occurred across sectors: manufacturing investment growth dropped to –4.3% in April (from +4.9% recorded in March); infrastructure investment growth slowed as well, recorded at –4.5% for April (versus +7.2% in March). Meanwhile, real estate investment continued to weaken in April, showing a contraction of −19.2% (–10.5% in March). The real estate market downturn was ongoing in April. On the demand side, decline in floor space sold for new residential properties narrowed slightly to −9.6% year on year, compared with –10.8% in March. On the supply side, the contraction of floor space started widened to −28.2% year on year in April, from –20.3% in March. |
|||||||||
|
|
|||||||||
|
|||||||||
|
|
|||||||||
|
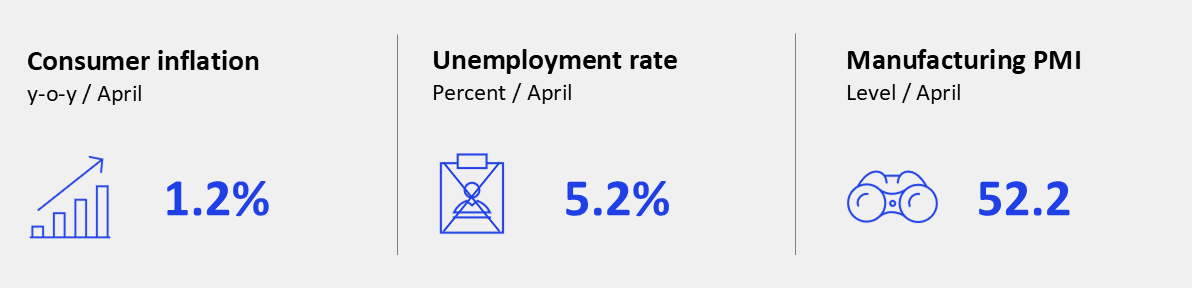
In April, new credit tumbled to RMB 0.6 trillion, down from RMB 5.2 trillion in March, representing a –46% year-on-year decline. Meanwhile, total social financing reached RMB 465.9 trillion in April, marking a 7.7% year-on-year increase and indicating a slowdown in growth.
The overall surveyed urban unemployment rate eased slightly to 5.2% in April. In April, cross-border trade (imports and exports) recorded a year-on-year growth rate of 18.7%, an acceleration from the 12.7% rise seen the previous month. Specifically, export growth accelerated to 14.1% in April, from 2.5% in March. Meanwhile, import growth maintained a robust growth rate of 25.3%, similar to the pace seen in March (27.8%). US president Trump had a three-day state visit to China in mid-May. Leaders from the world’s two largest economies have agreed on a new vision of building a constructive bilateral relationship of strategic stability. This is defined as “a positive stability with cooperation as the mainstay, a sound stability with moderate competition, a constant stability with manageable differences, and an enduring stability with promises of peace.” This may potentially provide short-term certainty around US-China ties, according to a local media release. |
|||||||||
|
|
|||||||||
|
|
|||||||||
|
India
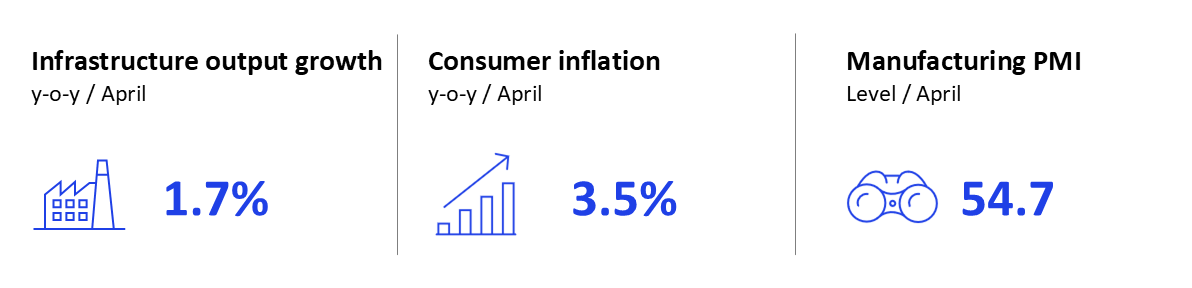
The United Nations has lowered India’s economic growth forecast for 2026 from 6.6% to 6.4%. This adjustment reflects global uncertainties and economic shocks from the West Asia crisis. Despite this, India remains one of the world’s fastest-growing major economies. HSBC’s Flash India purchasing managers’ index (PMI) remained in expansion in May. The manufacturing PMI eased to 54.3 from 54.7, while the Services Business Activity Index rose to 58.9 from 58.8. The survey noted softer growth in new orders, exports, and employment, with services outperforming manufacturing. India’s infrastructure output grew 1.7% year on year in April 2026, recovering from the revised 1.2% growth in March. Coal declined by 8.7% and crude oil fell by 3.9%. Natural gas contracted by 4.3% and refinery products edged down 0.5%. Cement and steel grew 9.4% and 6.2% respectively, while fertilizers fell sharply by 8.6%. The energy sector was impacted heavily by the ongoing geopolitical conflict. India’s retail inflation rose to 3.48% in April, a new high under the new consumer price index (CPI) series (base year 2024) and up from 3.40% in March. Food inflation increased to 4.20% from 3.87% in March. |
|||||||||
|
|
|||||||||
|
|||||||||
|
|
|||||||||
|
Inflation remains contained and below target but upside risks persist from higher energy prices linked to the West Asia conflict and potential weather-related disruptions to food supplies. Core inflation continues to be muted, though supply-chain dislocations and second-round effects could create uncertainty. Annual average inflation is projected at 4.6% in 2026–27, compared with 2.1% in 2025–26.
India’s merchandise exports rose to $43.56 billion in April 2026 while imports increased sharply to $71.94 billion, widening the trade deficit to $28.38 billion in April—this is attributable to disrupted global shipping routes and elevated freight and energy costs that have significantly impacted India’s import bill. Equity markets declined about 2% in May with the SENSEX at 75,415, down from April. The rupee came under sustained pressure, depreciating 2.5% over nine sessions in May before the Reserve Bank of India (RBI) intervened heavily with an estimated $2 billion to $3 billion in dollar sales to stabilize the currency near 96 per dollar. Markets rebounded in April supported by technology-related stocks and improving risk appetite, though they remained volatile due to the West Asia conflict. Forex reserves stood at $688.9 billion as of May 15, having fallen from $723.6 billion in February 2026. India and Canada successfully concluded a second round of negotiations for the proposed Comprehensive Economic Partnership Agreement (CEPA) with discussions held in accordance with the terms of reference signed by the trade ministers. India and New Zealand signed a landmark free-trade agreement on April 27, delivering duty-free access for all Indian exports across every sector once the agreement is ratified. The agreement creates structured pathways for Indian professionals, students, and businesses while protecting India’s sensitive agricultural sectors. RBI’s Monetary Policy Committee (MPC) kept the policy repo rate at 5.25% for a second consecutive meeting this year, retaining its neutral stance. The next MPC meeting is scheduled for June 3–5. |
|||||||||
|
|
|||||||||
|
|
|||||||||
|
Brazil
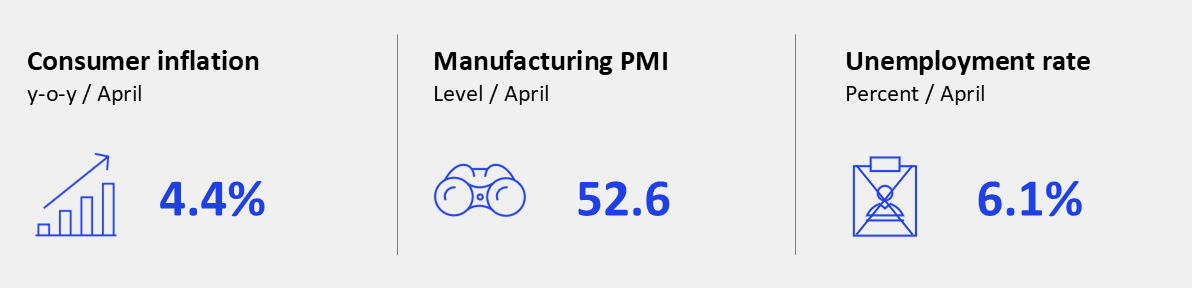
Following new policy rate cut, inflation and unemployment numbers are worsening. Inflation was up in April, touching 4.39% (against 4.14% in March) but below the central bank’s upper target limit of 4.50% for a sixth month in a row. In response to rising energy costs, the government unveiled a new subsidy of BRL 0.44 per liter for gasoline producers and importers to run for two months starting May 25. It is reportedly also considering additional measures to control diesel prices. The three-month moving average unemployment rate edged upwards towards 6.1% in March, compared with February’s 5.8%. On the financial markets, the average monthly real–US dollar exchange rate was BRL 5.03 per USD in April (BRL 5.22 in March). The Bovespa equities index trended sideways in April; however, performance has recently been worsening with the index down 5.6% as of May 15. |
|||||||||
|
|
|||||||||
|
|||||||||
|
|
|||||||||
|
Consumer confidence stayed below the neutral 100 mark, although FGV’s seasonally adjusted April reading moved up to 89.1. Meanwhile, business confidence slowed slightly to 90.6. Construction confidence reached 92.6, down from March’s 93.6.
Brazil’s manufacturing production increased: the Monthly Industrial Physical Production (PIM) Index climbed from 92.8 in February to 104.1 in March (above the neutral 100 line). Factory production increased 12.4%, while extractive production jumped 11%. On aggregate, however, March 2026’s results were only 4.3% above those from the same period last year. The Monthly Services Survey (PMS) revenue index increased to 130.35 in March from 119.23 in February (climbing further above the neutral 100 mark). This was mirrored in the volume index, which jumped to 109.26 (from 101.6). The largest revenue increase was in air transportation services (up 60.5%% since February), followed by other land transportation services (up 44.4%). Meanwhile, air transportation services’ volumes slid 37.7%, while the lodging services segment decreased 31.9%. April’s trade balance recorded a surplus of $10.5 billion, up from $6.5 billion in March. The bigger surplus was the result of a larger increase in exports ($34.1 billion in April, up from $31.7 billion in March) than in imports ($23.6 billion in April, down from $25.2 billion in March). In a unanimous decision on April 29, Banco Central do Brazil’s Monetary Policy Committee (Copom) decided to cut the Selic rate by 25 basis points, to 14.50%. Copom noted that, despite inflation projections rising above target, various factors, including the war in the Middle East, mean that uncertainty around the projections is higher than expected. Presidential hopeful Flávio Bolsonaro, son of former president Jair Bolsonaro, met US President Donald Trump at the White House on May 26. The photo opportunity is seen as a bid to put Bolsonaro junior’s presidential campaign back on track, following recent revelations about his connection with banker Daniel Vorcaro, who was jailed for fraud over the collapse of Banco Master. |
|||||||||
|
|
|||||||||
|
|
|||||||||
|
Russia
Russia’s economy contracted in first quarter of 2026; rising oil prices provided some relief for state budget but have not boosted low growth expectations.
The preliminary estimate from Russia’s economic development ministry shows GDP contracted by 0.3% year on year in Q1. Performance was particularly weak in the first two months of the year, when contraction was roughly 1.5% annually, driven by hikes in value-added tax at the start of the year and adverse weather conditions. The economy recovered in March, with GDP growth estimated at 1.8% annually. Headline industrial output showed resilience—over the full first quarter it was up by about 4% annually. However, sentiment differs between subcomponents. In April it improved for the extractive sector, driven by higher oil prices. By contrast, expectations around manufacturing remained subdued as in the preceding months. The sector has seen continuing support from industries linked to the war effort, while nearly all other manufacturing contracted. After a slow start this year, growth in the volume of retail sales revived in March and, in full Q1, reached 4% annually. Nevertheless, sequential growth was negative at –0.3% versus Q4 2025. |
|||||||||
|
|
|||||||||
|
|||||||||
|
|
|||||||||
|
Real wages continued to rise rapidly in the first months of the year, by nearly 9% annually in January–February, while the unemployment rate remained at a historically low level of around 2%.
Preliminary figures from the finance ministry show federal budget revenue contracted by 8% annually in the first quarter, while oil and gas revenues were down by 45%. In the same period, budget expenditures rose by 17%. The Q1 federal budget deficit ballooned to 2% of GDP, exceeding the projected budget deficit for the full year. More recently, public finances have revived in light of higher oil prices that have significantly increased Russia’s export earnings. OPEC estimates that the average export price of Russian crude oil was $74 a barrel in March and $96 a barrel in April, up from an average price of $40 a barrel in January–February. The United States also temporarily relaxed sanctions on exports of Russian oil. Both China and India have increased their oil imports from Russia. Even if it takes time to be reflected in reporting, this is clearly a boon for Russian government finances. Nevertheless, the budget is likely to remain in deficit throughout the year. Despite elevated oil prices, the Central Bank of the Russian Federation (CBR) left its GDP forecast unchanged at 0.5–1.5% this year. International forecasters have so far increased their GDP forecasts only slightly. For example, the IMF’s April outlook predicts Russian GDP growth this year will reach 1.1%, up from its January forecast of 0.8%. The April report from Consensus Economics stated that the average Russian GDP forecast for this year was 1%, only a touch higher than the consensus forecast of 0.9 % in February. |
|||||||||
|
|
|||||||||
|
|
|||||||||
|
Mexico
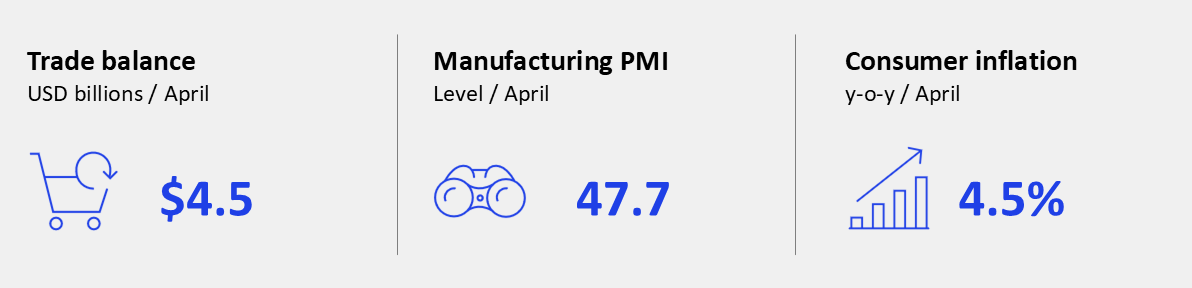
Mexico’s macroeconomic outlook mixed as GDP and manufacturing weaken, inflation eases, Banxico ends easing cycle, and peso resilient. Mexico’s GDP contracted by 0.6% quarter on quarter during the first quarter of 2026, and grew 0.4% annually. The Bank of Mexico cut the policy rate by 25 basis points to 6.5% on May 8 and announced the end of the easing cycle that began in March 2024. Annual inflation declined to 4.5% in April from 4.6% in March, the first decrease following three consecutive monthly increases. On the currency front, the average exchange rate stood at MXN 17.35 per USD during the first 15 days of May, after averaging MXN 17.42 in April. The purchasing managers’ index (PMI) for manufacturing fell to 47.7 in April from 48.9 in March, marking the sharpest deterioration in five months. Demand conditions declined further, with new orders contracting more sharply for a sixth straight month and export sales falling due to tariffs and weaker demand from Germany, Japan, and the United States. Labor market conditions remained relatively stable but showed signs of moderation. The unemployment rate rose to 2.8% in March from 2.7% in February. Formal employment increased by 23,923 jobs in April, bringing total formal employment to 22.7 million positions. Year-to-date formal job creation reached 330,935 jobs, supported by continued hiring in commerce, logistics, and business services, as well as ongoing labor formalization. |
|||||||||
|
|
|||||||||
|
|||||||||
|
|
|||||||||
|
Mexico recorded a trade surplus of $4.5 billion in April, compared with a $5.9 billion surplus in March. Exports climbed from $70.7 billion in March to $72.0 billion in April, while imports rose from $64.8 billion to $67.5 billion over the same period.
Moody’s downgraded Mexico’s sovereign credit rating from Baa2 to Baa3, the lowest level of investment grade, while also revising the outlook to stable. The agency cited weaker economic growth, rising public debt, a more rigid fiscal position, and continued financial support for state-owned petroleum and oil corporation Pemex as key factors limiting the government’s capacity to stabilize public finances. However, Moody’s noted that Mexico’s macroeconomic stability, policy responsiveness, and underlying economic strengths partly offset these fiscal pressures. Mexico and the European Union agreed to modernize their Global Agreement signed in 2000, which originally focused on trade liberalization and political cooperation. The new agreement significantly broadens the scope of the partnership by reducing or eliminating remaining tariffs on agricultural and industrial products, improving market access for services and public procurement, and strengthening investment protections through updated dispute-settlement mechanisms. The agreement also strengthens collaboration on security, migration, and critical raw materials, as both sides seek to deepen strategic ties and diversify trade relations amid growing global protectionism. |
|||||||||
|
|
|||||||||
|
|||||||||
|
|
|||||||||
|
|||||||||
|
McKinsey’s Global Economics Intelligence (GEI) provides macroeconomic data and analysis of the world economy. Each monthly release includes an executive summary on global critical trends and risks, as well as focused insights on the latest national and regional developments. Detailed visualized data for the global economy, with focused reports on selected individual economies, are also provided as PDF downloads on McKinsey.com. The reports available free to email subscribers and through the
McKinsey Insights App. To add a name to our subscriber list,
click here. GEI is a joint project of
McKinsey’s Strategy and Corporate Finance Practice and the
McKinsey Global Institute.
Shubham Singhal is the Chair of McKinsey's Global Institute and a senior partner in the Detroit office; Arvind Govindarajan is a partner in the Boston office. The data and analysis in McKinsey’s Global Economics Intelligence are developed by Jeffrey Condon, a senior expert in McKinsey’s Atlanta office; Krzysztof Kwiatkowski is an expert in the Boston office. The authors wish to thank Nick de Cent, as well as Masud Ally, José Álvares, Roman Büschgens, Darien Ghersinich, Gabriel Marini, Tomasz Mataczynski, Frances Matamoros, Alejandro Morales, Beatriz Oliveira, Debdoot Ray, Erik Rong, Vanshika Tandon, Valeria Valverde, and Sebastian Vargas for their contributions to this article. |
|||||||||
|
|||||||||
|
The invasion of Ukraine continues to have deep human, as well as social and economic, impact across countries and sectors. The implications of the invasion are rapidly evolving and are inherently uncertain. As a result, this document, and the data and analysis it sets out, should be treated as a best-efforts perspective at a specific point of time, which seeks to help inform discussion and decisions taken by leaders of relevant organizations. The document does not set out economic or geopolitical forecasts and should not be treated as doing so. It also does not provide legal analysis, including but not limited to legal advice on sanctions or export control issues.
|
|||||||||
|
|
|||||||||
|